What have I learned about crime from Chicago data?

Since 2001, Chicago city collects a record of all the crimes registered by their police. For the last few years, they share those data on Chicago Data Portal. This is a great source of knowledge if we want to learn something about crime, and it gets even more interesting if we add meteorological data for that period (for instance for O’Hare Airport Station, from NOAA’s National Centers for Environmental Information). Analyzing them both, we can observe a few interesting correlations between time, weather, and the number of crimes.
To make this post more attractive, I have a challenge for those readers interested in data science or data processing: download mentioned datasets (links in the previous paragraph) and implement data processing to check my results. For those who are less ambitious, I added a link to a code snippet presenting how this task can be done (in descriptions below visualizations). You can use it for learning, or as a hint if you don’t know how to calculate a concrete metric. Have fun ;)
The number of crimes decreases
Saying that the number of crimes decreases over time is not a popular claim, but Chicago data clearly supports it (brief research confirmed that the number of crimes decreases at least in the period 2001 to 2019 for most big cities in the US and EU). In 2019 there were more or less 2 times fewer crimes than in 2001, even though the population grew from 2.8 M to 8.8 M.
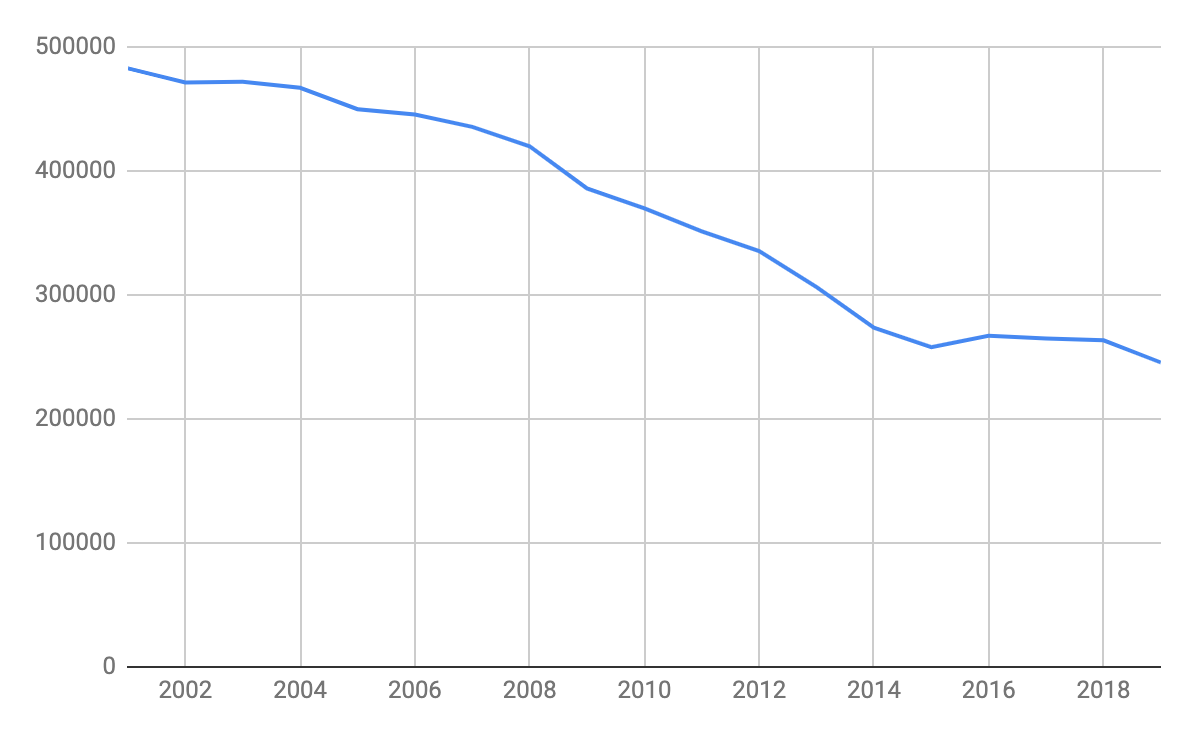
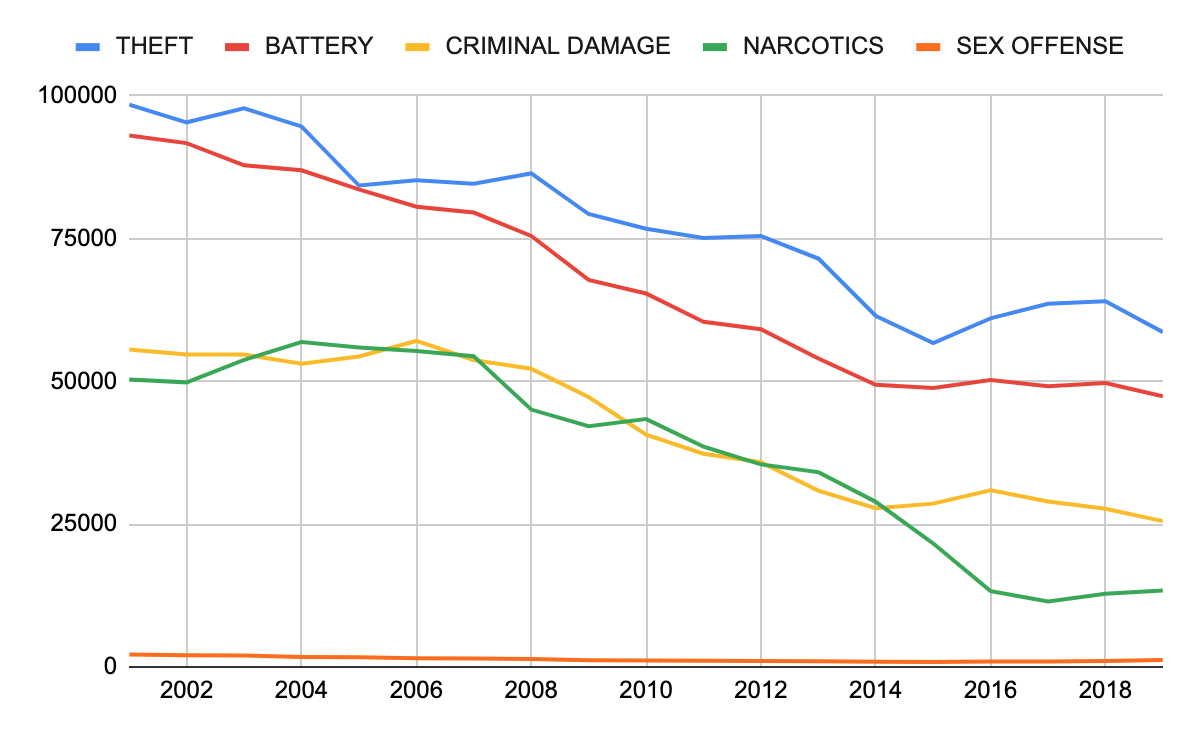
Is it a result of real positive changes, or maybe it is something else, such as loosening drug policy? To answer this question, we can review our data a bit more and check out what are the trends in different categories. So let’s start with analyzing the size of each category:
| Typ | Liczba |
| THEFT | 1470337 |
| BATTERY | 1280265 |
| CRIMINAL DAMAGE | 796818 |
| NARCOTICS | 716674 |
| ASSAULT | 438977 |
| OTHER OFFENSE | 433657 |
| BURGLARY | 397223 |
| MOTOR VEHICLE THEFT | 321094 |
| DECEPTIVE PRACTICE | 272647 |
| ROBBERY | 263090 |
| CRIMINAL TRESPASS | 199841 |
| WEAPONS VIOLATION | 77025 |
| PROSTITUTION | 68410 |
| PUBLIC PEACE VIOLATION | 49235 |
| OFFENSE INVOLVING CHILDREN | 45584 |
| CRIM SEXUAL ASSAULT | 27488 |
| SEX OFFENSE | 25276 |
| INTERFERENCE WITH PUBLIC OFFICER | 16712 |
| GAMBLING | 14470 |
| LIQUOR LAW VIOLATION | 14178 |
| ARSON | 11488 |
| HOMICIDE | 10014 |
| KIDNAPPING | 6807 |
| INTIMIDATION | 4086 |
| STALKING | 3569 |
When we analyze different significant categories, we can see that the number of crimes decreases in all of them. The number of crimes in the NARCOTICS category does decrease faster, but they constitute only 10% of them all, so it is not enough to make such a significant overall decrease.
The number of crimes fluctuates cyclically over a year and a week
The average number of crimes in each month fluctuates cyclically over a year. It is clearly visible if we visualize the average number of crimes per day in each month (to eliminate the problem with months having an unequal number of days).
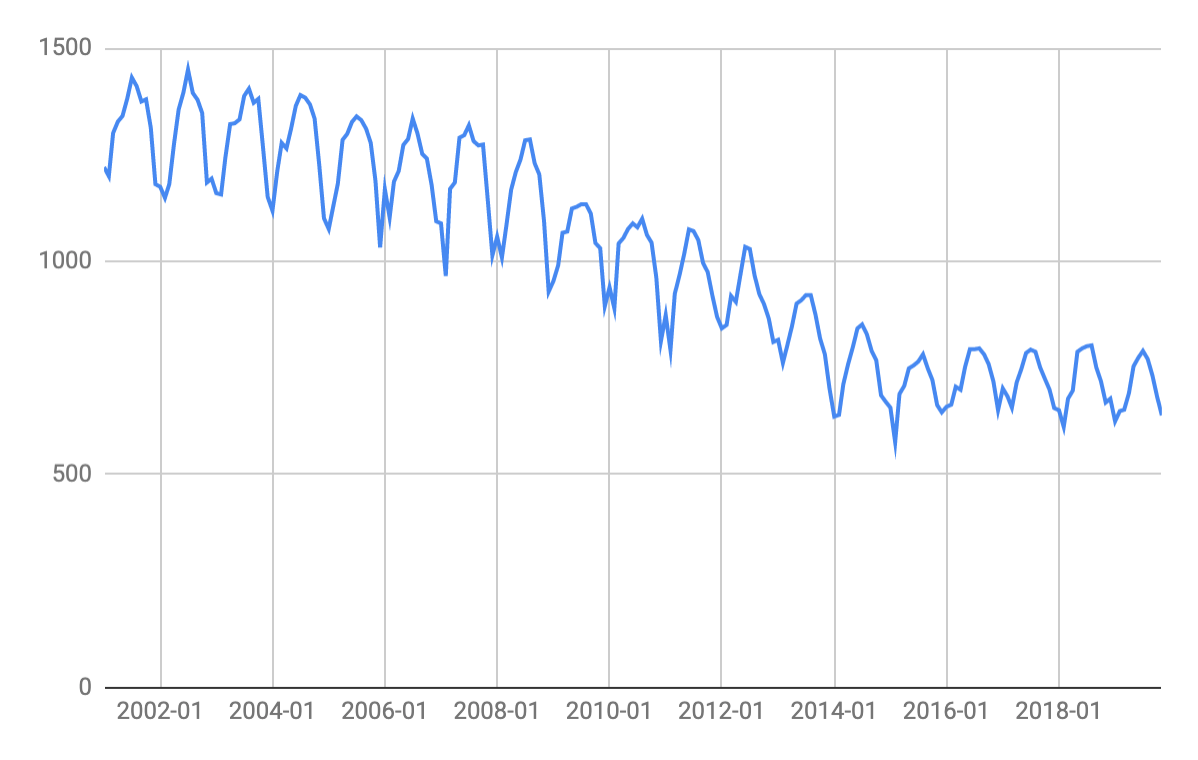
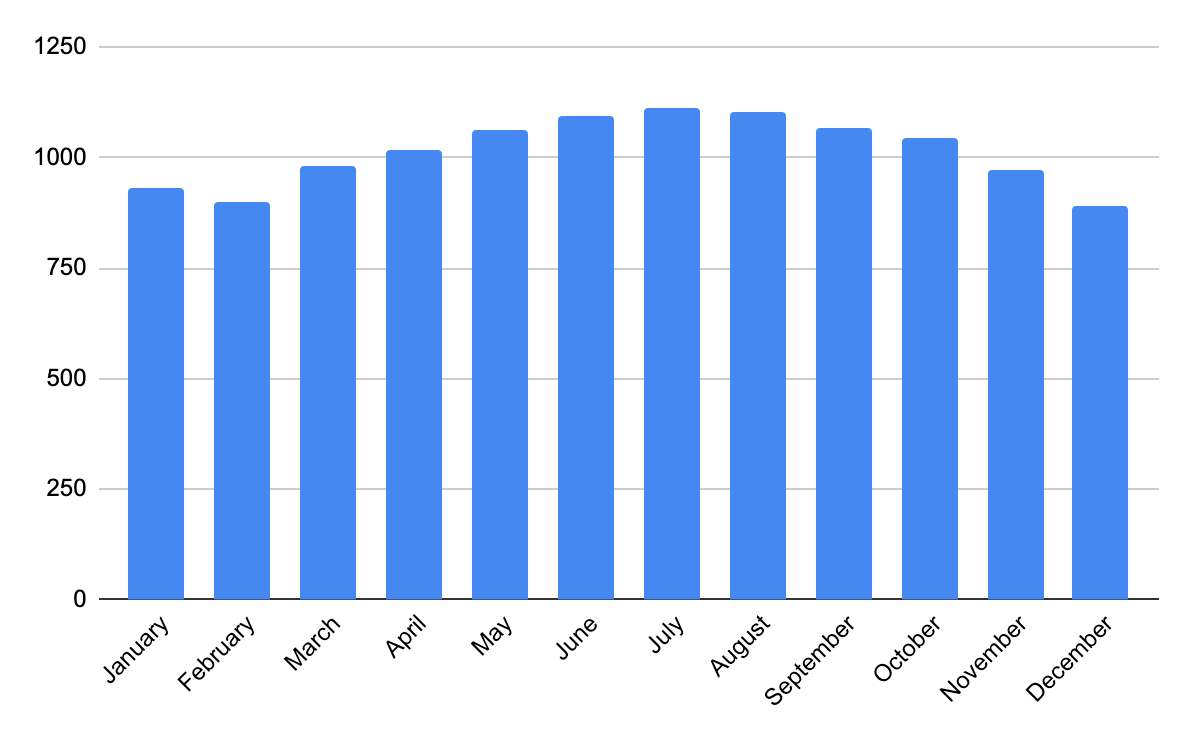
December seems to be the time when criminals take vacations. Probably after working hard in July.
What is interesting, the number of crimes fluctuates cyclically over a week as well. Although this trend is less visible. Criminals seem to be the most active on Fridays (likely because people party then) and the least active on Sundays - who knows why, maybe their conscience stops them from making crimes on the holly day? Or maybe the police are less active then? Or maybe we all need to have free Sunday.
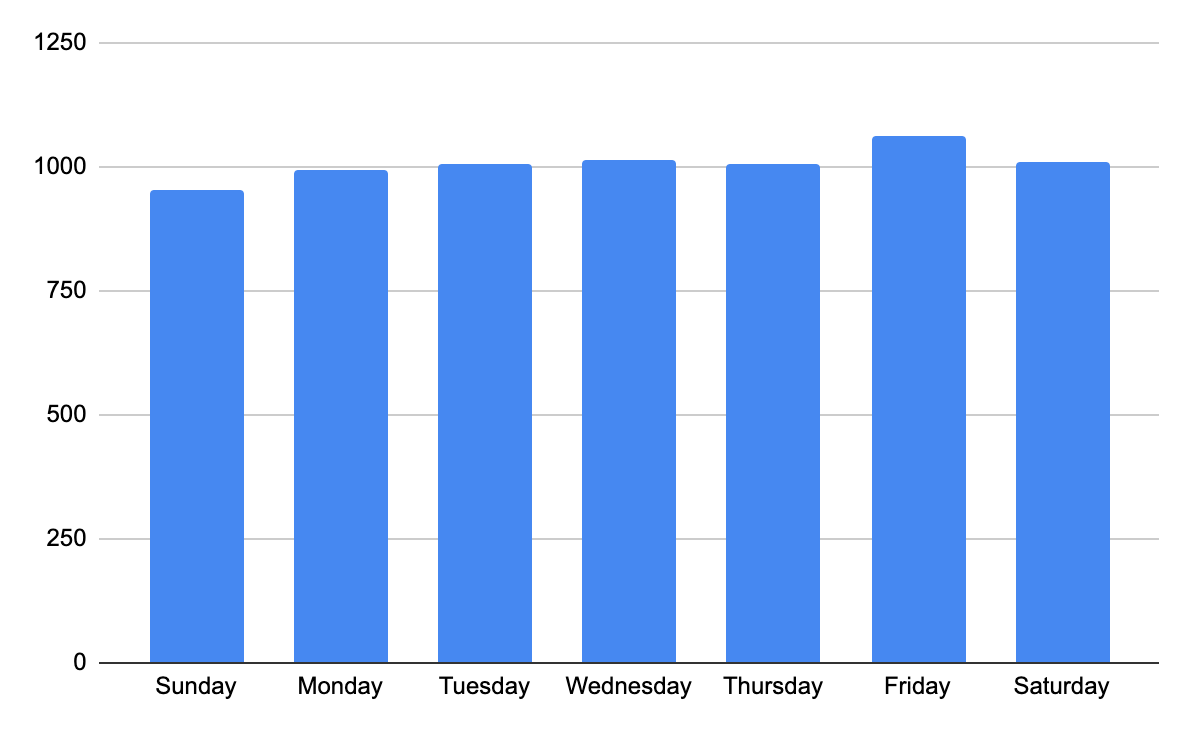
An interesting question is where those cyclical fluctuations come from. One significant reason is the temperature that fluctuates over the year, and as it turns out, it is strongly correlated with the number of crimes.
Relationship between the temperature and the number of crimes
On average, the higher the temperature, the more crimes. Here is the average number of crimes for the next temperature ranges.
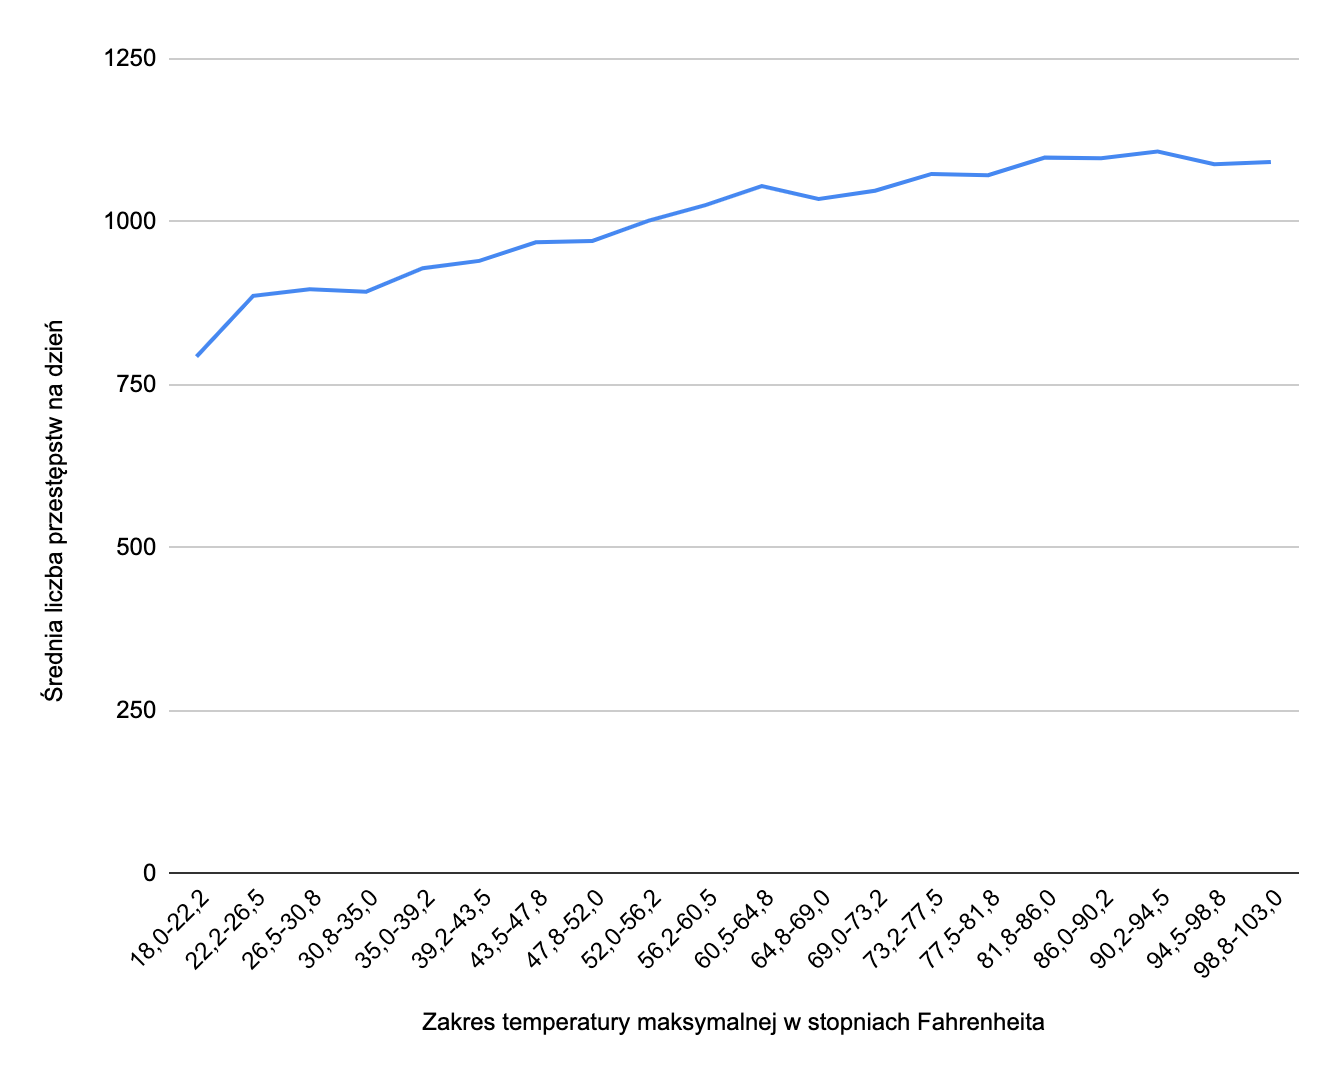
On the very cold days, we have, on average, 771.9 crimes per day. On the other end of the extreme, on the very hot days, we have, on average, 43% more, which is 1105.7 crimes per day. This trend can be seen in most categories, but not in all. Some are clearly more dependent on the temperature than the others.
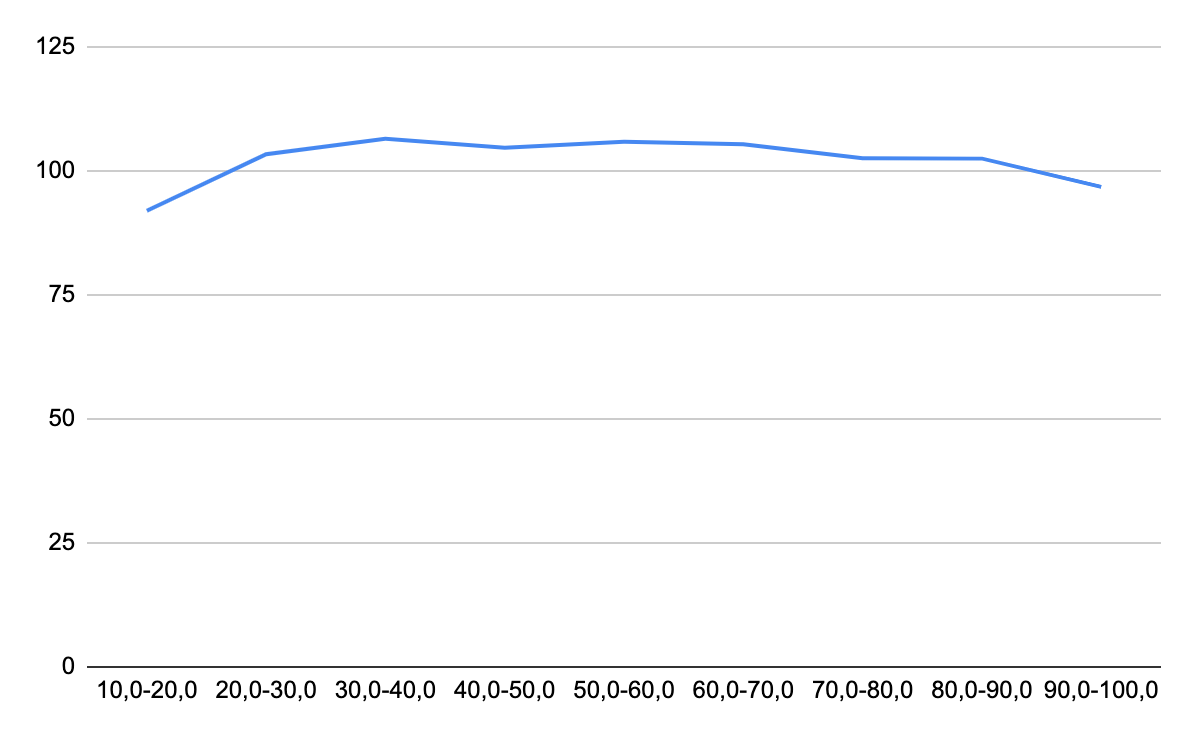
For instance, in NARCOTICS there is no increase at all - even a small decrease can be observed.
On the other hand, THEFT and BATTERY categories are even more dependent on the temperature than the average.
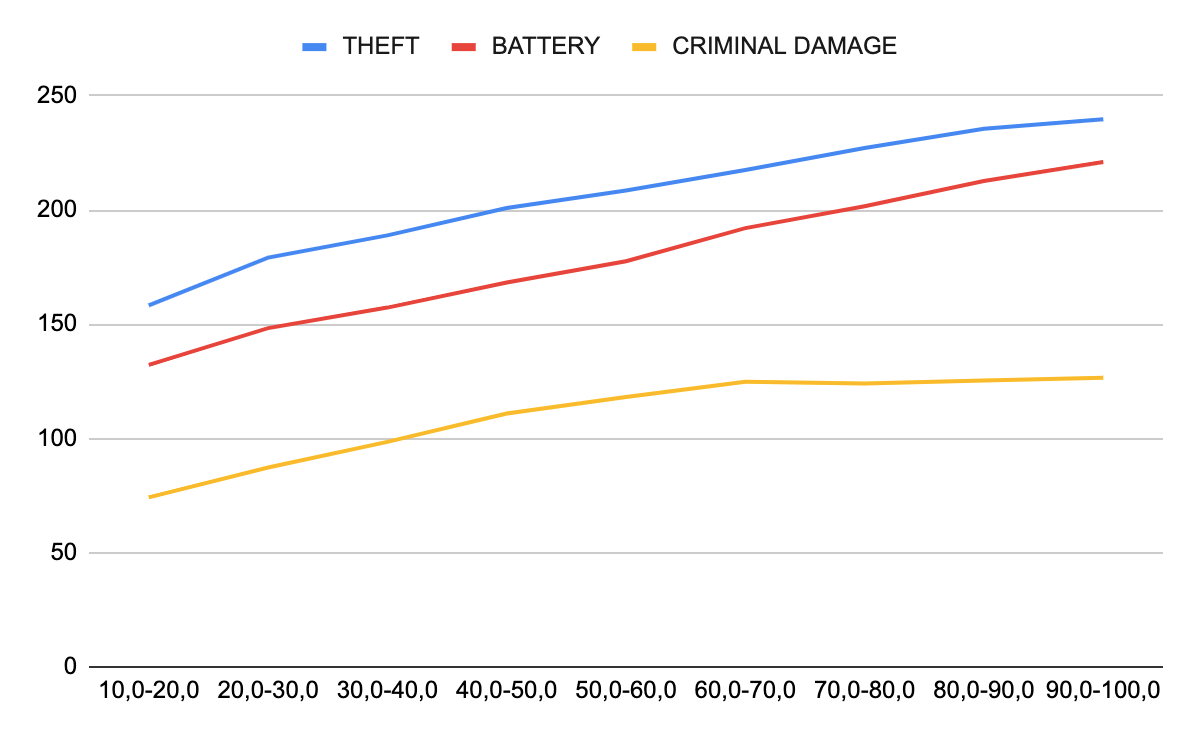
A reason might be that the hotter it gets, the more time we spend outside, and there are more occasions for some kinds of crimes.
Summary
In this article, we’ve seen some observations based on the Chicago crime database. The conclusions are not new to the criminology but might be interesting for those not proficient in this discipline. The number of crimes:
- decreases over time,
- grows with temperature,
- fluctuates cyclically over a year, with a maximum in July and minimum in February,
- fluctuates cyclically over a week, with a maximum on Friday and minimum on Sunday.
I hope you managed to check out those conclusions yourself, using your code. If not, remember that you still have a chance. If you’ve got any questions, ask in the comments section. I am also interested in what is your feeling about this article. Let me know using the below buttons.